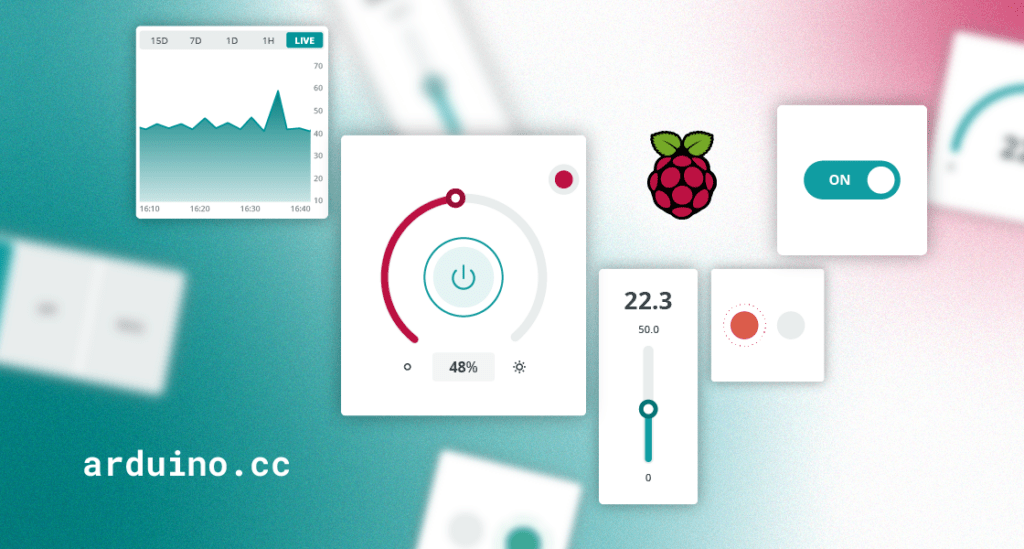
Hey there, DIY IoT enthusiasts! Ever build a cool gadget with your Raspberry Pi, only to get stuck figuring out how to show off its data? Don’t worry, you’re not alone. Lots of makers like you face the same challenge: turning that awesome sensor data into something easy to see and interact with on your phone or laptop.
The good news is, there are simple and reliable ways to bridge that gap and shed light on your data without losing time.
Visualize your Raspberry Pi data: Get started
Raspberry Pi and other Linux-based platforms have become popular in the IoT space due to their versatility and ease of use. However, a common issue is finding an effective way to visualize their data and connect them to visualization platforms.
At the end of the day, what do you want? You have your code which is producing data and you want to have a dashboard to visualize it both in real-time and its historical evolution. Furthermore, you would like to interact directly with your application from that dashboard too!

Let’s explore what kind of solutions you have at your disposal.
Choosing a visualization platform for your Raspberry Pi
You can visualize your device’s data by installing a visualization platform on your device or sending data to an external platform, self- or cloud-hosted. Each has its pros and cons, and the choice depends on your skills, time, and the complexity of the solution.
Installing a visualization platform on your device also implies setting up local data storage, like a database. This process along with the platform installation and maintenance can be complex and time-consuming, especially for beginners.
Transferring data to an external platform is typically easier as they usually offer a simple API to interact with them, but the type of solution can add complexity:
- If you opt to establish your own platform and infrastructure, it may seem like you have more control over the solution. However, it can quickly become an overwhelming task for beginners, and ongoing maintenance can be even more challenging.
- Choosing a cloud-hosted solution often seems like the most balanced option. However, it can also be complicated due to the wide range of alternatives, varying levels of complexity, and pricing models that can be difficult to understand.
Some of these alternatives were also described in a previous article, where we explored several ways to visualize data coming from Arduino or ESP32 based boards.
Choosing the right programming language for your Raspberry Pi
But now, what? You have to program your application to collect data. Selecting the right programming language can depend on many different factors. Knowledge of the environment or simply your preference can be a deciding factor. But sometimes the decision is not so simple. Here we have some insights about some popular IoT programming languages
- Python: Python is a top choice for IoT development due to its simplicity, rich library ecosystem, and active community. Its dominance in AI allows seamless integration of machine learning models.
- JavaScript: JavaScript, with Node.js as a server-side runtime environment, is also a go-to language for IoT device development. It’s versatile and its event-driven nature aligns seamlessly with IoT requirements. It’s particularly popular for applications that interact with web pages, thanks to the potential for significant code reuse.
- Node-RED: Lastly, low-code programming environments like Node-RED have become very popular for IoT. It allows you to create your applications with an intuitive drag-and-drop interface, connecting hardware and platforms, and controlling anything from tiny sensors to the cloud.
Note: While other languages like C/C++ and Rust are also relevant, this blog post focuses on Python, JavaScript, and Node-RED due to their popularity and relative ease of use.
Creating IoT monitoring dashboards with Arduino Cloud
The Arduino Cloud is a cloud-hosted platform that provides a user-friendly environment to create customizable insightful dashboards used to monitor and control your IoT devices.
We recently announced that you can now seamlessly connect Python, MicroPython and JavaScript applications with the Arduino Cloud.
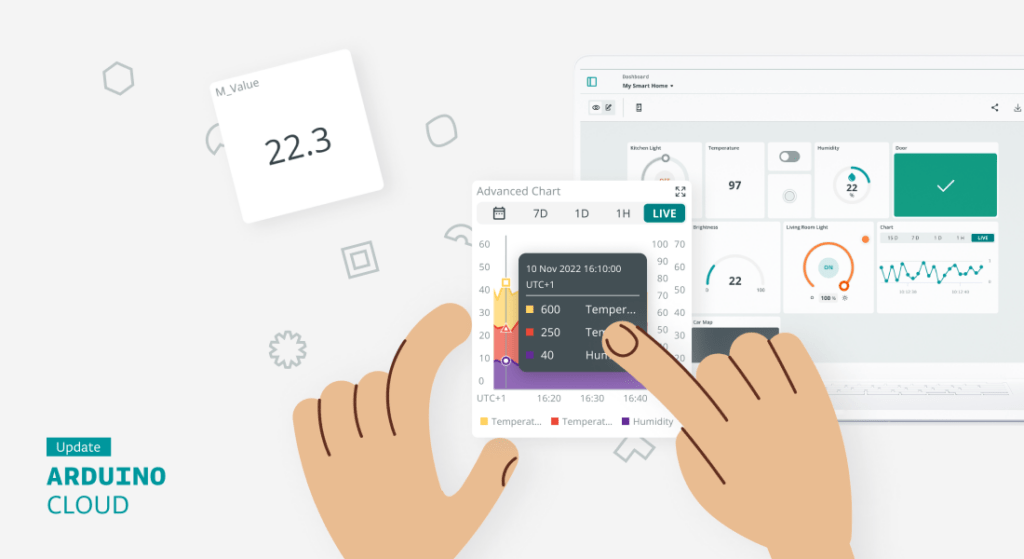
The main benefit is its ease of use. You get rid of installation or maintenance headaches, while you connect your devices in minutes and visualize the data in your dashboards either from your browser or your mobile phone. You can create and customize your dashboards with an intuitive interface using drag-and-drop widgets. These dashboards provide real-time interaction with your IoT devices and insightful historical information that can be additionally downloaded for offline analysis.
But there are many other cool features:
- Real-time alerts: You can receive notifications based on criteria configured in the Cloud. Learn more in this post.
- Mobile phone app: You can access your dashboards using the IoT Remote app.
- Work collaboratively: You can share your code and dashboards with others.
- Out-of-the box integrations: You have seamless integration with popular platforms like IFTTT, Zapier, Google Services, Alexa or Google Home.
Want to learn more? Check out this recent article announcing four new IoT monitoring dashboard features that may seem small, but pack a big punch for your connected projects. They include the ability to duplicate IoT Dashboards, IoT Value Widget customization, new data aggregation method, and more.
How to connect your Raspberry Pi to Arduino Cloud
Connecting your Raspberry Pi to Arduino Cloud couldn’t be easier. You only have to follow these steps:
1. Set up an Arduino Cloud account.
2. Add your device to the Arduino Cloud as a Manual device.
3. Create your Thing and add your variables.
4. Create the code for your Raspberry Pi using your preferred development language and environment.
5. Create the dashboards for data visualization.
So, do you want to remotely monitor your Raspberry Pi creations and control them from anywhere? Stay tuned! Upcoming posts will showcase real-world examples of connecting your Raspberry Pi to the Arduino Cloud, enabling you to visualize sensor data and interact with your projects remotely. In the meantime, here’s a project from Project Hub showing an integration with Raspberry Pi using Python to show VCO2 data from a SGP30 sensor.
Start with Arduino Cloud for free
Arduino Cloud is free to use. So, if you’re looking to streamline data visualization of your Raspberry Pi applications, consider giving the Arduino Cloud a try and leverage its full potential for your projects. You can explore the premium features for enhanced functionality.
The post A guide to visualize your Raspberry Pi data on Arduino Cloud appeared first on Arduino Blog.
